
Monitoring and Observability
In summary, while monitoring gives you immediate alerts on known issues, observability provides the full context needed to diagnose and understand complex problems.
Both are crucial: monitoring keeps you informed about current states, and observability helps you troubleshoot and improve your system’s performance by revealing the hidden “why” behind the numbers.
Monitoring
What is the state of the system? Is it working as expected? Is it performing well? Monitoring helps to answer these questions and provides valuable insights into the system’s performance.
Definition: The process of observing a system’s behavior in real time or near real time, using tools that track and report the system’s status, events, or incidents.
Goal: To identify anomalies, failures, or trends that need attention.
Observability
Why is the system behaving this way? What caused the issue? Observability helps to answer these questions by providing insights into the system’s internal state and behavior.
Definition: Observability is the ability to understand the internal state of a system based on its external outputs. It is about understanding the system’s behavior and performance based on the data it generates.
Goal: To diagnose root causes and understand why the system behaves as it does.
The Three Pillars of Observability
Modern observability relies on three complementary data types that work together to provide complete system visibility:
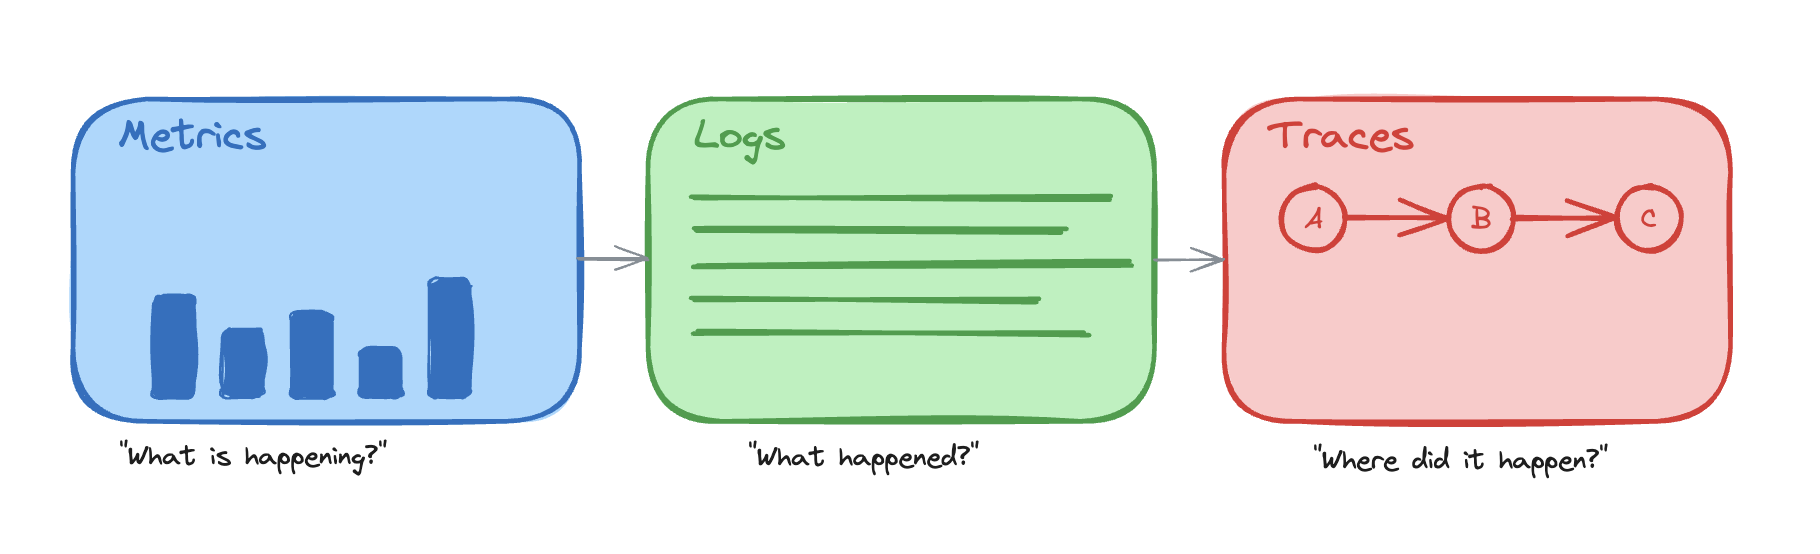
- Metrics - Aggregated measurements that answer “What is happening?”
- Quantitative data over time (CPU usage, request rates, error percentages)
- Efficient for detecting that a problem exists
- Logs - Discrete events that answer “What happened?”
- Individual records of specific events with context
- Essential for debugging specific occurrences
- Traces - Request flows that answer “Where did it happen?”
- End-to-end visibility of requests across services
- Critical for understanding causality and service interactions
How they work together:
- Metrics alert you that error rates spiked at 2:00 PM
- Logs show specific error messages and stack traces from affected requests
- Traces reveal which service in the chain caused the failures
Each pillar is valuable alone, but their real power comes from correlation. Linking metrics, traces, and logs gives you the complete picture of the system’s behavior.
Metrics
How much? How often? How long? Metrics provide the raw data needed to measure, analyze, and optimize the system’s functionality over time.
Definition: Quantifiable data points that measure various aspects of a system or application, such as performance, resource usage, or throughput.
Goal: To provide a basis for analysis, comparison, and optimization. Identify that a problem exists.
Common Metric Examples
- CPU and memory usage: Average, max, min utilization
- Example: 50% CPU usage, 4GB of 8GB memory used
- Network latency: Average, max, min response times
- Example: 100ms average latency, 500ms p99
- Request rates: Requests per second
- Example: 1,000 requests/second
- Error rates: Percentage of failed requests
- Example: 1% error rate (5xx responses)
- Application-specific metrics: User logins, transactions, feature usage
- Example: 100 user logins/second, 50 transactions/minute
Framework Metrics
Most modern frameworks provide built-in metrics and instrumentation:
- Web Frameworks: Request/response times, endpoint hit counts, status code distributions
- Database ORMs: Query execution time, connection pool statistics, query counts
- Message Queues: Queue depth, message processing time, consumer lag
- HTTP Clients: Request duration, retry counts, timeout rates
These framework metrics can be automatically collected using APM (Application Performance Monitoring) tools or custom instrumentation.
Custom Metrics
Custom metrics are application-level metrics you define, instrument, and emit—unlike built-in infrastructure or framework metrics (CPU, memory, request counts). They capture behavior only your system knows about. Examples:
- Business Metrics:
- User actions: Signups, purchases, form submissions
- Feature usage: Button clicks, feature adoption rates
- Conversion rates: Funnel completion, checkout success
- Domain-Specific Metrics:
- Processing success/failure rates for specific workflows
- SLA compliance for critical operations
- Resource consumption per tenant (in multi-tenant systems)
- Technical Metrics:
- Custom cache effectiveness
- Third-party API call success rates
- Background job completion times
Custom metrics should be:
- Meaningful: Aligned with business goals or operational needs
- Actionable: Enable decisions or trigger alerts
- Performant: Minimal overhead on the application
Traces
Traces are a sequence of events that happen in a system. They are used to trace the flow of a request through the system.
Goal: To understand the flow of a request through the system. Identify the root cause of a problem.
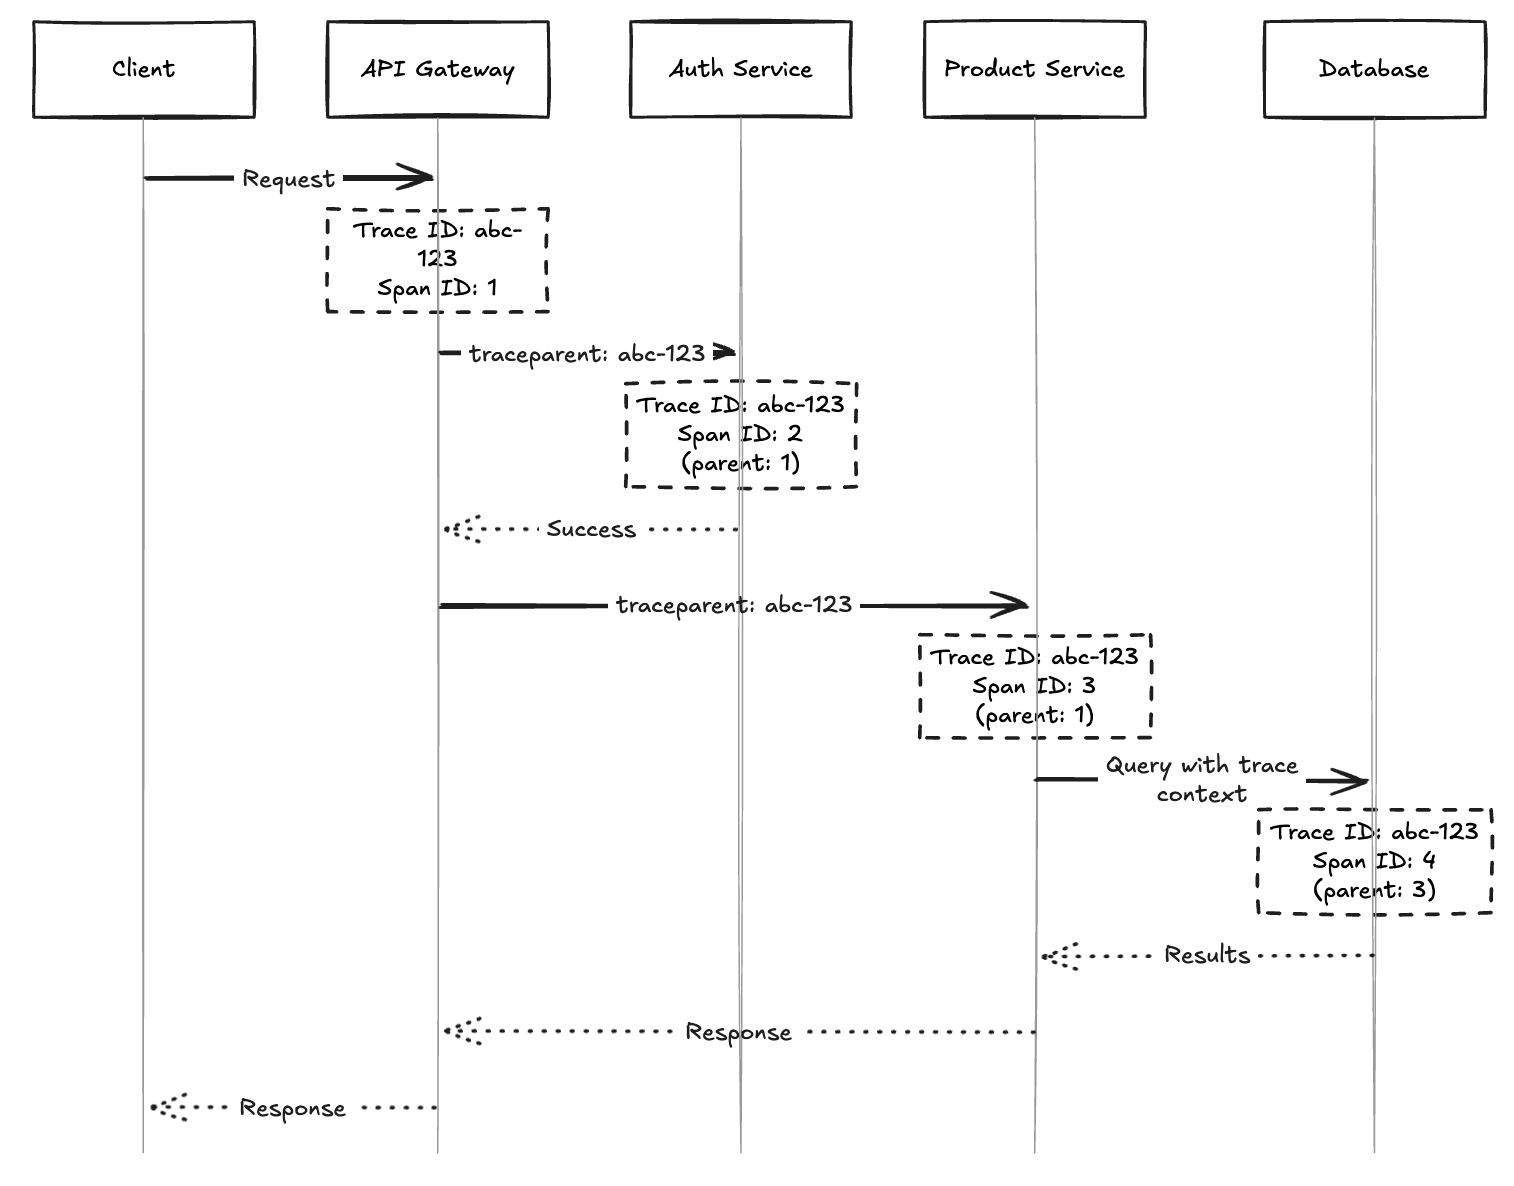
Distributed Tracing tracks requests as they flow through multiple services in a distributed system. Each trace consists of multiple spans that represent individual operations.
How Trace Identifiers Work
When a request enters the system, it’s assigned a unique Trace ID that follows the request through all services and components. Each operation within the trace gets its own Span ID, creating a hierarchical structure that shows parent-child relationships.
Key Components:
- Trace ID: Unique identifier for the entire request journey
- Span ID: Unique identifier for each operation within the trace
- Parent Span ID: Reference to the parent operation, creating the call hierarchy
- Timestamp: The time the operation started
Trace context is propagated between services using HTTP headers (e.g., traceparent, X-Trace-Id), message queue metadata, or gRPC metadata.
Logs
What happened? When did it happen? What was the context? Logs provide detailed event records that help diagnose issues and understand system behavior.
Definition: Logs are immutable, timestamped records of discrete events that happened in your system. They capture what occurred, when it occurred, and relevant context.
Goal: To provide detailed event-level information for debugging, auditing, and understanding specific system behaviors that metrics and traces cannot capture.
For a comprehensive guide on logging best practices, including what to log, how to structure logs, and language-specific recommendations, see Logging - What, Why and How?.
Structured Logging and Correlation
Use structured formats (JSON, key-value) instead of plain text—they enable parsing, searching, and correlation with traces and metrics. Include a trace_id (and optionally request_id, user_id) in each log entry. Searching by trace ID reveals the full request journey across services and lets you jump from a metric alert or trace span directly to the relevant logs.
Basic Monitoring of a Web Application
Backend System
Resource Usage
Do we have enough capacity? Is the infrastructure healthy?
- CPU usage: Average, max, and per-core utilization
- Memory usage: Total, available, and swap usage
- Disk usage: Space utilization and I/O operations
- Network usage: Bandwidth, packet loss, and connection count
- Database connection pool usage: Active, idle, and waiting connections
- Cache hit rate: Percentage of successful cache hits vs. misses
- Queue length: Number of pending items in message queues and background job processing time
- Auto-scaling metrics: Instance count and scaling events (for high-traffic systems)
Application Performance
Is the application responding? How fast? Are requests succeeding?
- Request rate: Requests per second
- Error rate: Percentage of failed requests (4xx, 5xx)
- Latency: Average, p50, p95, p99 response times
- Response time: Time to first byte and total response time
- Throughput: Data processed per unit of time
- Service degradation: Partial failure handling, downstream service failures, circuit breaker status (for high-traffic systems)
- Rate limiting: Throttled requests, rate limit usage, blocked requests (for high-traffic systems)
Custom Business Metrics
Beyond infrastructure and performance, add application-level metrics that reflect your domain:
- User actions: Signups, logins, purchases, form submissions
- Feature usage: Adoption rates, button clicks, workflow completion
- Third-party integrations: API call success rates, external service latency
- Background jobs: Completion time, failure rate, queue depth
- Cache effectiveness: Hit rate for critical caches
These metrics answer “is the business functioning?” and help correlate technical issues with user impact.
API Endpoints
For high-traffic or critical systems, monitor metrics at the endpoint level to identify problematic routes and optimize performance.
Per-Endpoint Metrics
- Response time: Average, p50, p95, p99 latency for each endpoint
- Example:
GET /api/usershas 150ms p95,POST /api/ordershas 800ms p95
- Example:
- Error rate: Percentage of failed requests per endpoint
- Example:
GET /api/productshas 0.5% errors,POST /api/checkouthas 2% errors
- Example:
- Request rate: Number of requests per second for each endpoint
- Example:
GET /api/healthreceives 100 req/s,GET /api/productsreceives 50 req/s
- Example:
- Status code distribution: Breakdown of 2xx, 4xx, 5xx responses
- Example: 95% 200, 3% 404, 2% 500
- Payload size: Request and response body sizes
- Example: Average response size of 2KB for listing endpoints
Endpoint Monitoring Strategy
- Critical endpoints: Monitor all metrics with tight alerting thresholds
- Payment processing, authentication, core business operations
- High-traffic endpoints: Focus on performance and capacity metrics
- Search, listing pages, dashboard endpoints
- Low-traffic endpoints: Monitor error rates and occasional performance checks
- Admin functions, reporting endpoints
Frontend
Frontend monitoring focuses on user experience and performance from the client’s perspective. These metrics are especially important for search engine rankings, as Google and other search engines use them as ranking factors. For application-like websites (web apps), these might not matter as much, as UX can be improved with loading spinners, skeleton screens, and progressive loading patterns.
Core Web Vitals (Google’s UX Metrics)
- Largest Contentful Paint (LCP): Time until the largest content element is visible
- Target: < 2.5 seconds (Good), < 4.0s (Needs improvement)
- First Input Delay (FID): Time from user interaction to browser response
- Target: < 100ms (Good), < 300ms (Needs improvement)
- Cumulative Layout Shift (CLS): Visual stability during page load
- Target: < 0.1 (Good), < 0.25 (Needs improvement)
Performance Metrics
- Time to First Byte (TTFB): Time until first byte received from server
- Example: 200ms for static pages, 500ms for dynamic content
- First Contentful Paint (FCP): Time until first content appears
- Example: 1.2 seconds
- Time to Interactive (TTI): Time until page is fully interactive
- Example: 3.5 seconds
- Total Page Load Time: Complete page load including all resources
- Example: 4.2 seconds
- Bundle size: JavaScript and CSS file sizes
- Example: 250KB JS bundle (gzipped), 50KB CSS
User Experience Metrics
- JavaScript errors: Client-side error count and error rate
- Track stack traces and affected user sessions
- Note: Browsers often generate noise from adblockers, extensions, and third-party scripts - filter these out to focus on actual application errors
- API call failures: Failed requests from frontend to backend
- Example: 2% of API calls return errors
- Important: Frontend-side error monitoring is often more critical than backend-side. A 400 Bad Request from the API perspective might not be immediately concerning (anyone can send malformed data), but if your frontend receives a 400, it indicates a bug since you control what your application sends. Monitor 4xx errors from the frontend perspective carefully.
- Page views and navigation: User flow and popular routes
- Browser and device distribution: Chrome 85%, Safari 10%, Mobile 60%
- Session duration: Average time users spend on the site
Alerting
Monitoring and metrics are only valuable if issues are detected and acted upon quickly. Immediate alerting is vital to minimize downtime, reduce impact on users, and prevent small issues from escalating into major outages. Teams must be notified the moment critical thresholds are breached or anomalies are detected.
Effective alerting ensures that:
- Problems are caught early before they impact many users
- Response times are minimized with automated notifications
- The right people are notified based on severity and on-call schedules
- Alert fatigue is avoided through proper threshold tuning and noise reduction
For a comprehensive guide on handling alerts efficiently, see Managing Issue Alerts.
Monitoring Tools
- Frontend: Google Lighthouse, Web Vitals library, Sentry, LogRocket
- Backend/APM: Datadog, New Relic, Prometheus + Grafana, AppDynamics
- Distributed Tracing: Jaeger, Zipkin, OpenTelemetry
- Logging: ELK Stack (Elasticsearch, Logstash, Kibana), Splunk, Loki
- Infrastructure: CloudWatch (AWS), Azure Monitor, Google Cloud Monitoring
Practical Example
For a hands-on example of implementing monitoring, metrics, traces, and observability in a real application, check out Monitoring Example Project. This project demonstrates:
- OpenTelemetry instrumentation across multiple languages (Python, Go, .NET, Node.js)
- Distributed tracing with Tempo
- Metrics collection with Prometheus
- Logging with Loki and structured log correlation
- Exemplars linking metrics to traces
- Grafana dashboards for business and infrastructure metrics
- SLO-based alerting with error budgets
The project includes a complete microservices setup with Docker Compose, realistic traffic generation, and comprehensive documentation to help you understand modern observability practices.
Summary
- Monitoring is about knowing the state of the system.
- Observability is about understanding the system’s behavior.
- The three pillars of observability are metrics, logs, and traces.
- Metrics are about the state of the system.
- Metrics are “automatically” collected by the system.
- Custom metrics are application-level metrics you define. They capture behavior only your system knows about.
- Logs are about what happened.
- Traces are about where it happened.
- Monitoring and observability are complementary.